Is your neighborhood making you sick? Use this tool to find out
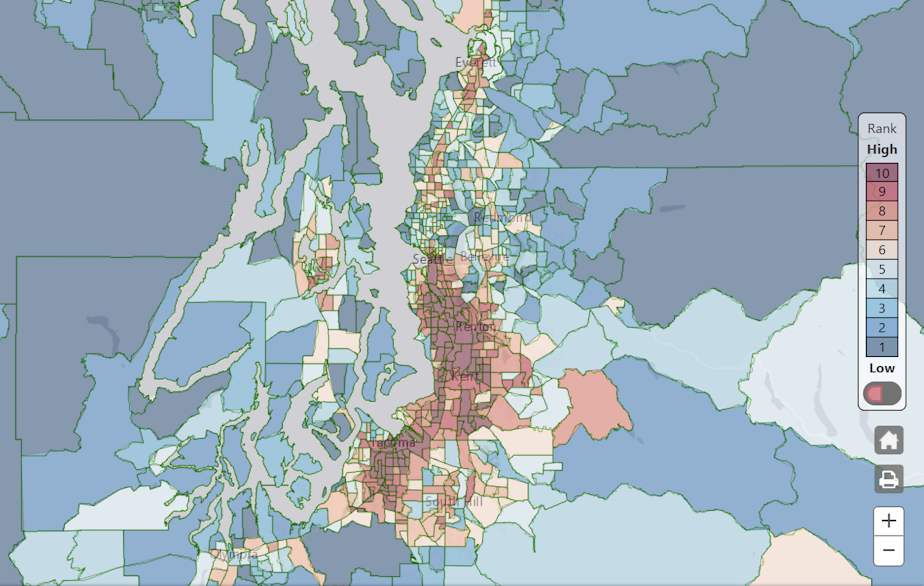
A new mapping tool can help you learn more about the state of environmental health, wherever you live in Washington.
The new Washington environmental health disparities map is the first to rank neighborhoods by all the environmental and socioeconomic factors that affect people’s health.
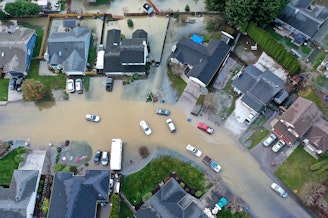
People of color and low-income communities are far more likely to live near contaminated sites and sources of toxic pollution. These factors – race, income, and proximity to hazardous pollution – combine to make some communities more susceptible to health problems, like cardiovascular disease and asthma, than others.
The new map shows how those multiple factors interact with one another and compound to create vulnerable communities.
Deric Gruen is the program director for Front and Centered, one of the organizations involved in the map's creation. He says the map could have implications for how lawmakers approach environmental policies in the state.
“This map helps policymakers think about where the areas are facing the greatest health disparities and makes investments to lift up those communities so all communities have an equal chance at clean air and clean water,” Gruen said.
Sponsored
The map was created by a partnership of organizations, including the University of Washington, the Washington State Department of Health, Front and Centered, Puget Sound Clean Air Agency and Environmental Public Health Tracking . Local communities also provided input on the project.
-
Kamna Shastri

Community Outreach Producer
Kamna is a community outreach coordinator. She connects with organizations and individuals with the goal of building relationships and deepening trust between KUOW and all the communities who share space in our region.
More stories from Kamna Shastri »